


1
2
3
4
5
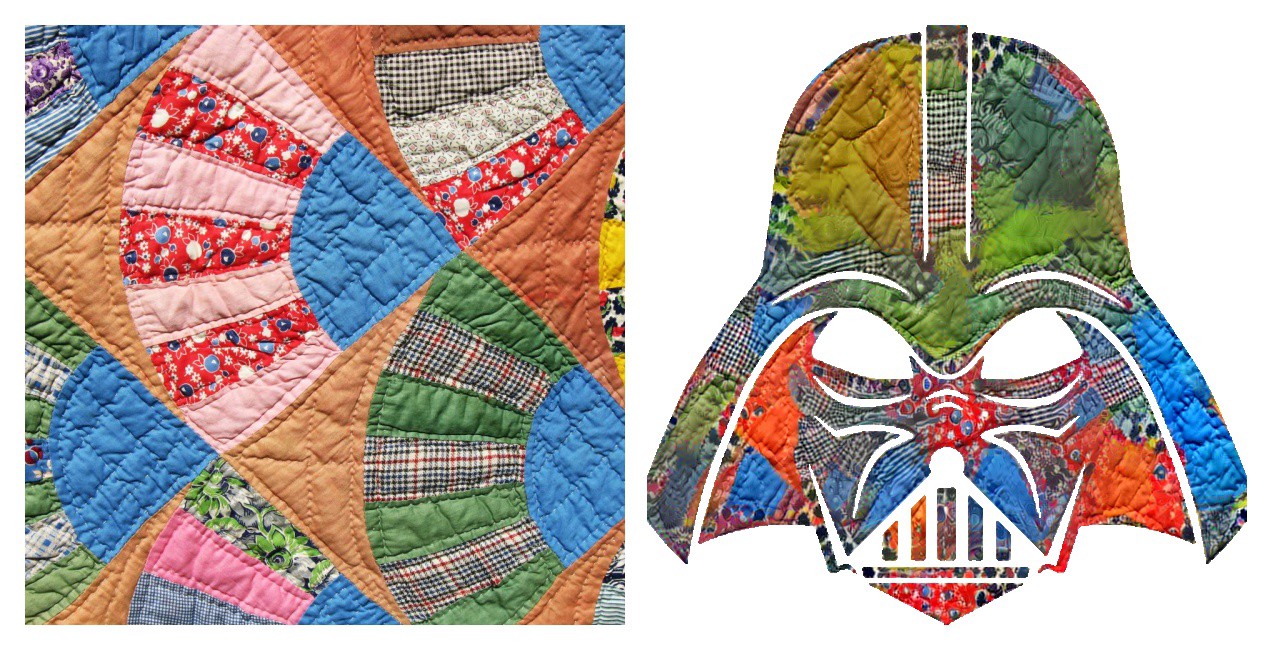
Creating Intricate art with Neural Style Transfer
This is a fun project where I applied Gatys' artistic neural style transfer algorithm with silhouettes and doodles to generate novel patterns and intricate art. The silhouettes facilitated the algorithm to give a neat finish to the style. Documentation and code are provided here.
Analyzing Driver Signup and First trip rates for a ride sharing service
This is a synthetic dataset for ridesharing that shows the details of driver sign-up data. The data consists of when the drivers signed up, the city, sign-up OS, sign-up channel (paid, referred, etc.). Once they signed up for the driving, they are requested to be available for background check, add their vehicle and once those stages are cleared, they are then allowed to start picking up passengers.
Here, the company wants to maximize the trips taken by the drivers. There may be several hurdles before first trip is taken, such as, the background check may be negative, or the drivers may fail to add their vehicle, and so on. This data analysis will try to find the important factors that is involved in the first trip taken by the drivers. And consequently, some recommendations are suggested based on the analysis.
Click here for the code and dataset.
Spatial Renewable Power Plant Locator Tool in GIS
A spatial tool was developed using ArcGIS and ArcPy framework to identify optimal locations of renewable energy power plants.
Click here to learn more.
Bi-objective algorithm for modal choice
A bi-objective algorithm that optimizes time and money is developed for the modal choices in the San Francisco Bay Area region. Here, the users choose between driving and BART during the peak and non-peak hours. The model also estimates the cost and emissions of their choices.
Click here to learn more.
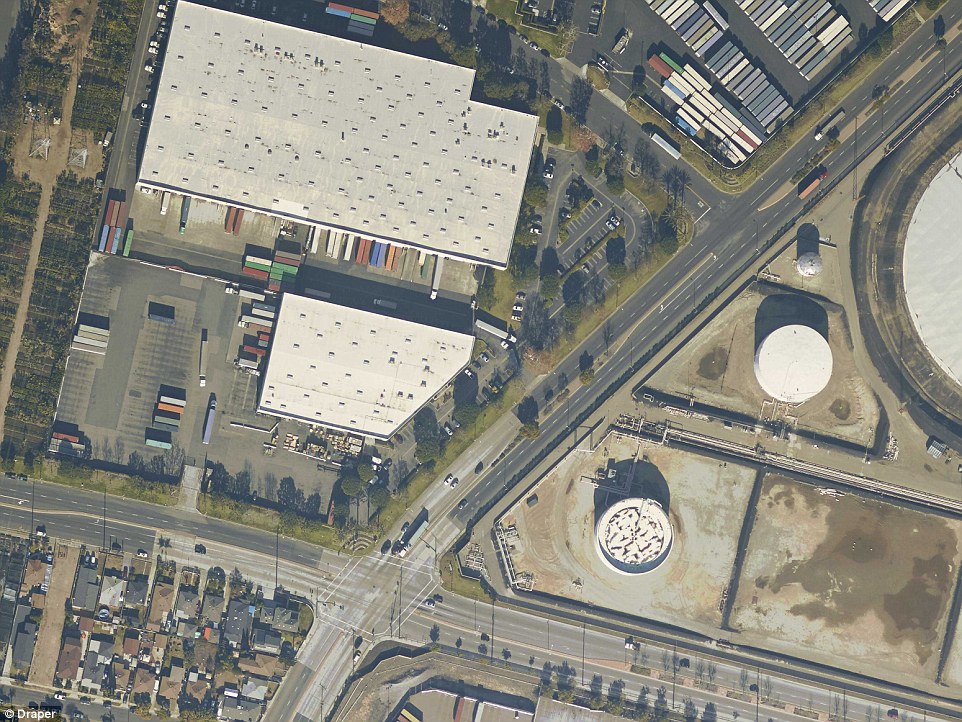
Exploratory Analysis of Draper Chronology Challenge
Kaggle introduced Draper satellite image chronology challenge, where five sets of images were given representing each day. The challenge was to arrange the images in the test data which were given in random order.
I did a simple exploratory analysis on the a set of training data images, using basic computer vision techniques (Sobel edge detection, RGB bands, Hough transform and SURF point detections).
The Github link to the IPython code is here.